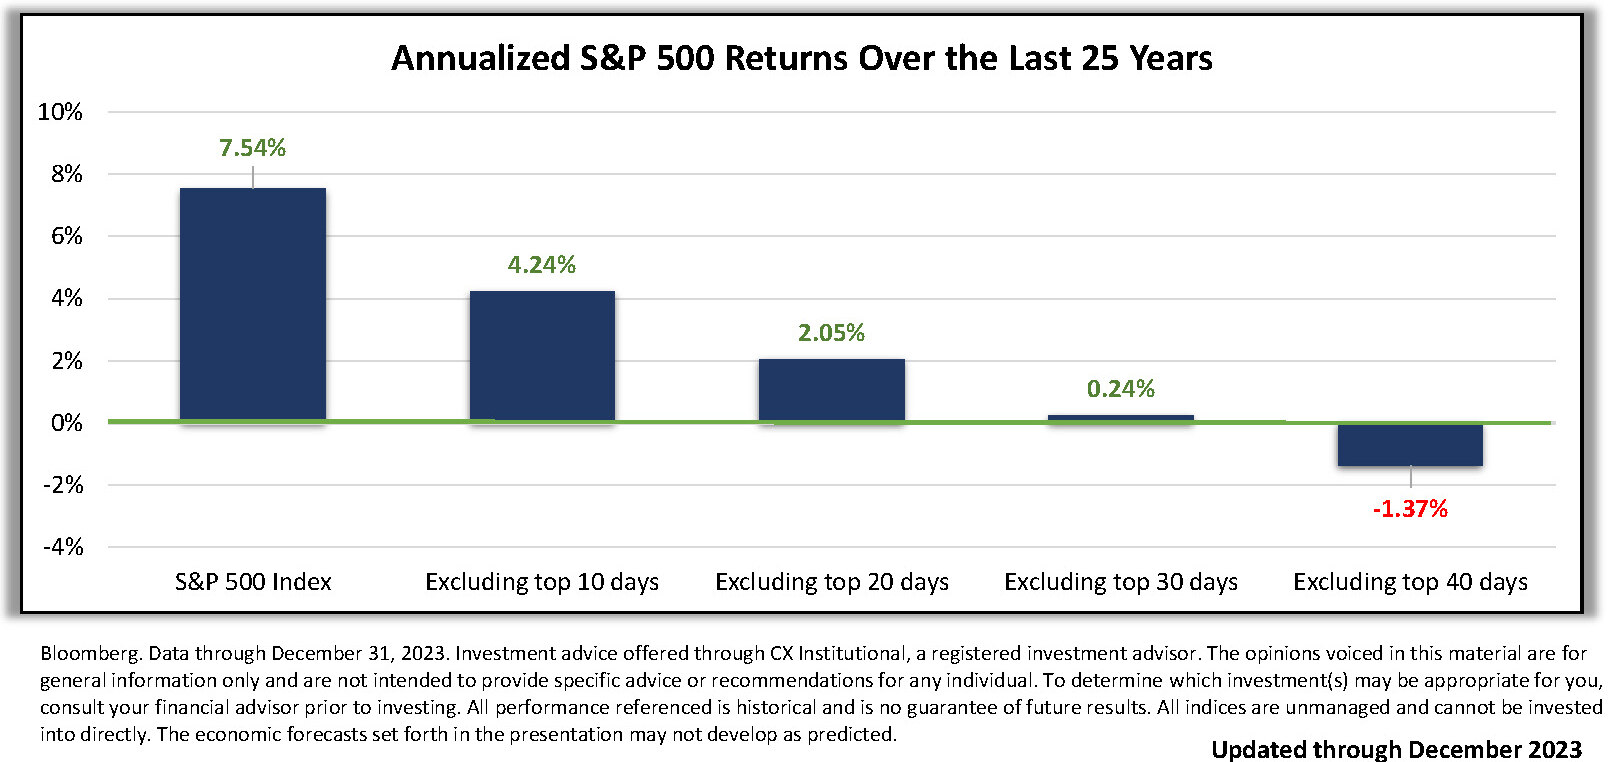
Chart Content: Annualized S&P 500 Index returns over the past 25 years compared to annualized S&P 500 Index returns over the same time frame when missing the top 10, 20, 30, and 40 days in the market.
Chart Significance: Missing the best-performing days in the market over the past 25 years resulted in a weaker annualized return compared to staying invested throughout the entire period. For example, an investor who remained fully invested in the S&P 500 over the past 25 years would have realized an annualized return of 7.54%, while an investor who missed the top 10 days would have realized an annualized return of only 4.24%. On a $100,000 initial investment, this equates to a market value reduction of over $333,000 during the 25-year span.
Potential Forward-Looking Implications: The U.S. stock market has been resilient throughout its history as stocks have consistently recovered from short-term corrections and bear markets to move higher over longer time horizons. Trying to predict the best time to buy and sell may cause investors to realize subpar returns, reducing the likelihood of achieving long-term goals. Market timing is exacerbated by the fact that a majority of the market’s best days tend to occur in periods of economic distress. Simply put, time in the market is more important than timing the market. History shows that investors who acknowledge the fact that downturns are an inevitable part of investing, look beyond short-term volatility, and remain invested have a greater chance of achieving long-term success.

